![]()
Microwave Radio
Terrain Diffraction Modeling
II. Model Used
III. Testing / Results
IV. References
1. Testing
The model was tested using known sets of terrain and received power data. A special function was created and used to calculate the error:
function [ map,err ] = calculateall( cellinfo ) |
This produced error maps which were easily readable and showed where the largest errors occurred. A sample output of this function, taken from Cell Site A, is seen below.
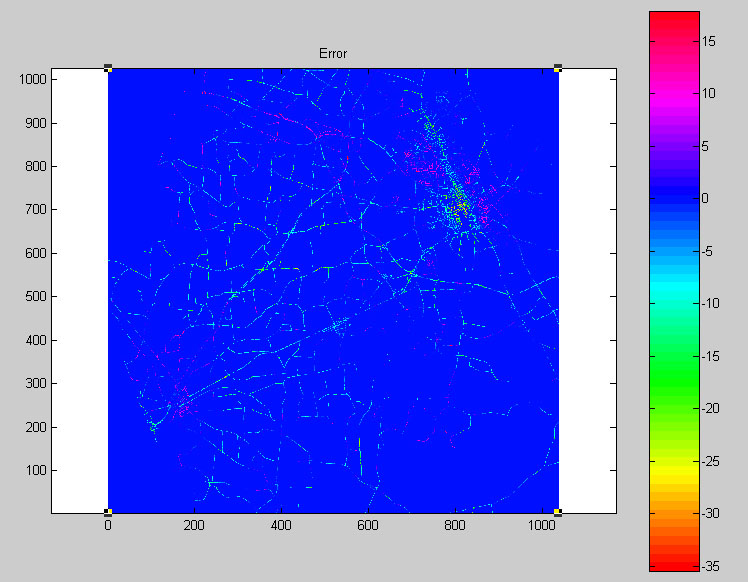
2. Results
>> CompareMaps('Measurements_ABCD.mat','test.mat'); |
While each map was close to the true values, there were errors that cannot be neglected. When the error map from each cell site was compared to the respective elevation maps, it was noticed that the largest errors occurred near dramatic changes in elevation.